
Inflation Isn’t Coming Back
That's good news for asset prices

“Inflation is always and everywhere a monetary phenomenon in the sense that it is and can be produced only by a more rapid increase in the quantity of money than in output.” —Milton Friedman

[3 minute read]
Fading inflation fears in the middle of an energy shock is a contrarian take.
Yet the data suggests we should.
Inflation is likely to peak around 4% then retreat towards the 2% long term average.
I know what you’re thinking.
Tariffs and energy will prove me wrong.
So let’s look at the data.
Tariffs
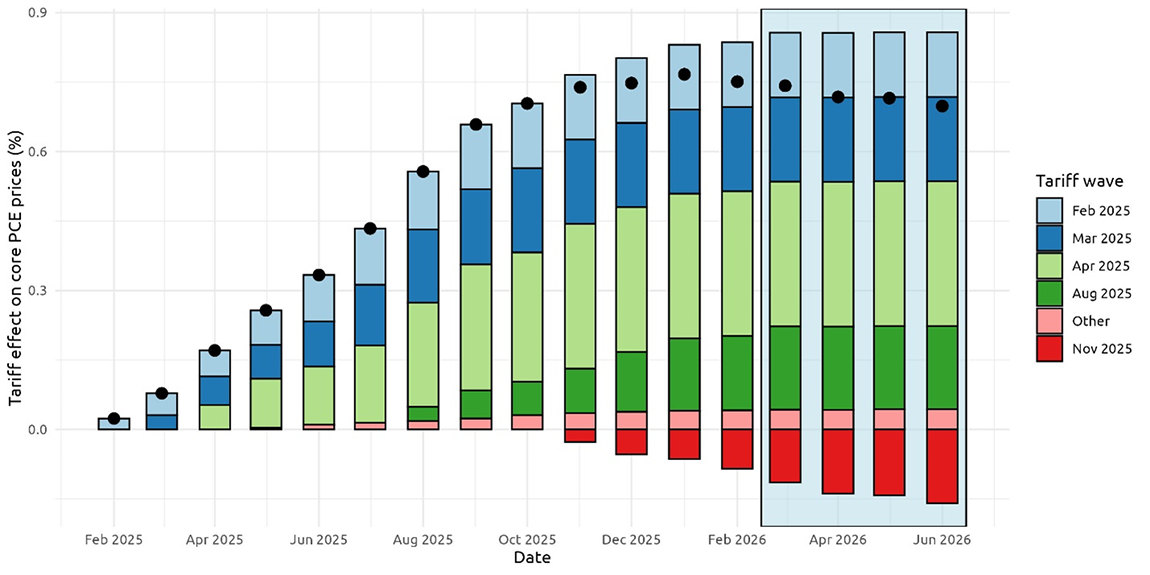
A recent study by the Federal Reserve demonstrated that tariffs contributed 0.8% to consumer prices.1
The inflation impact peaked in January and is already falling.
That’s because inflation is measured year-over-year.
Tariffs are a one-time increase in prices.
By December, the impact will be neutral.
By January 2027, tariffs will begin to pull inflation down until the 0.8% increase has been reversed.
Energy
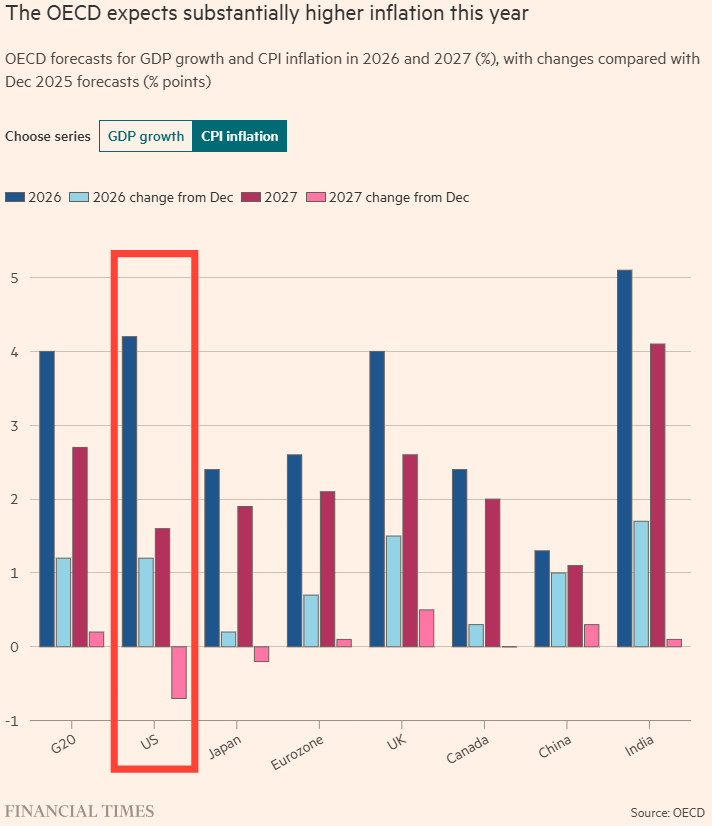
The Organization for Economic Cooperation and Development (OECD) estimates the energy shock will add 1.2% to U.S. inflation.2
If correct, inflation will peak around 4.2% in 2026.
If energy prices stay elevated but plateau, the 1.2% increase will reverse by 2027.
The OECD’s own estimates have inflation declining below 2.0% by 2027 as year-over-year impacts fade.
Stress Case
What if oil prices increase by another 50%? 100%?
What about knock-on effects like plastics, fertilizer, and food prices?
A more severe energy shock will destroy demand, driving down prices in other categories.
Consumers stressed at the pump will spend less at restaurants, on hotels, and elsewhere.
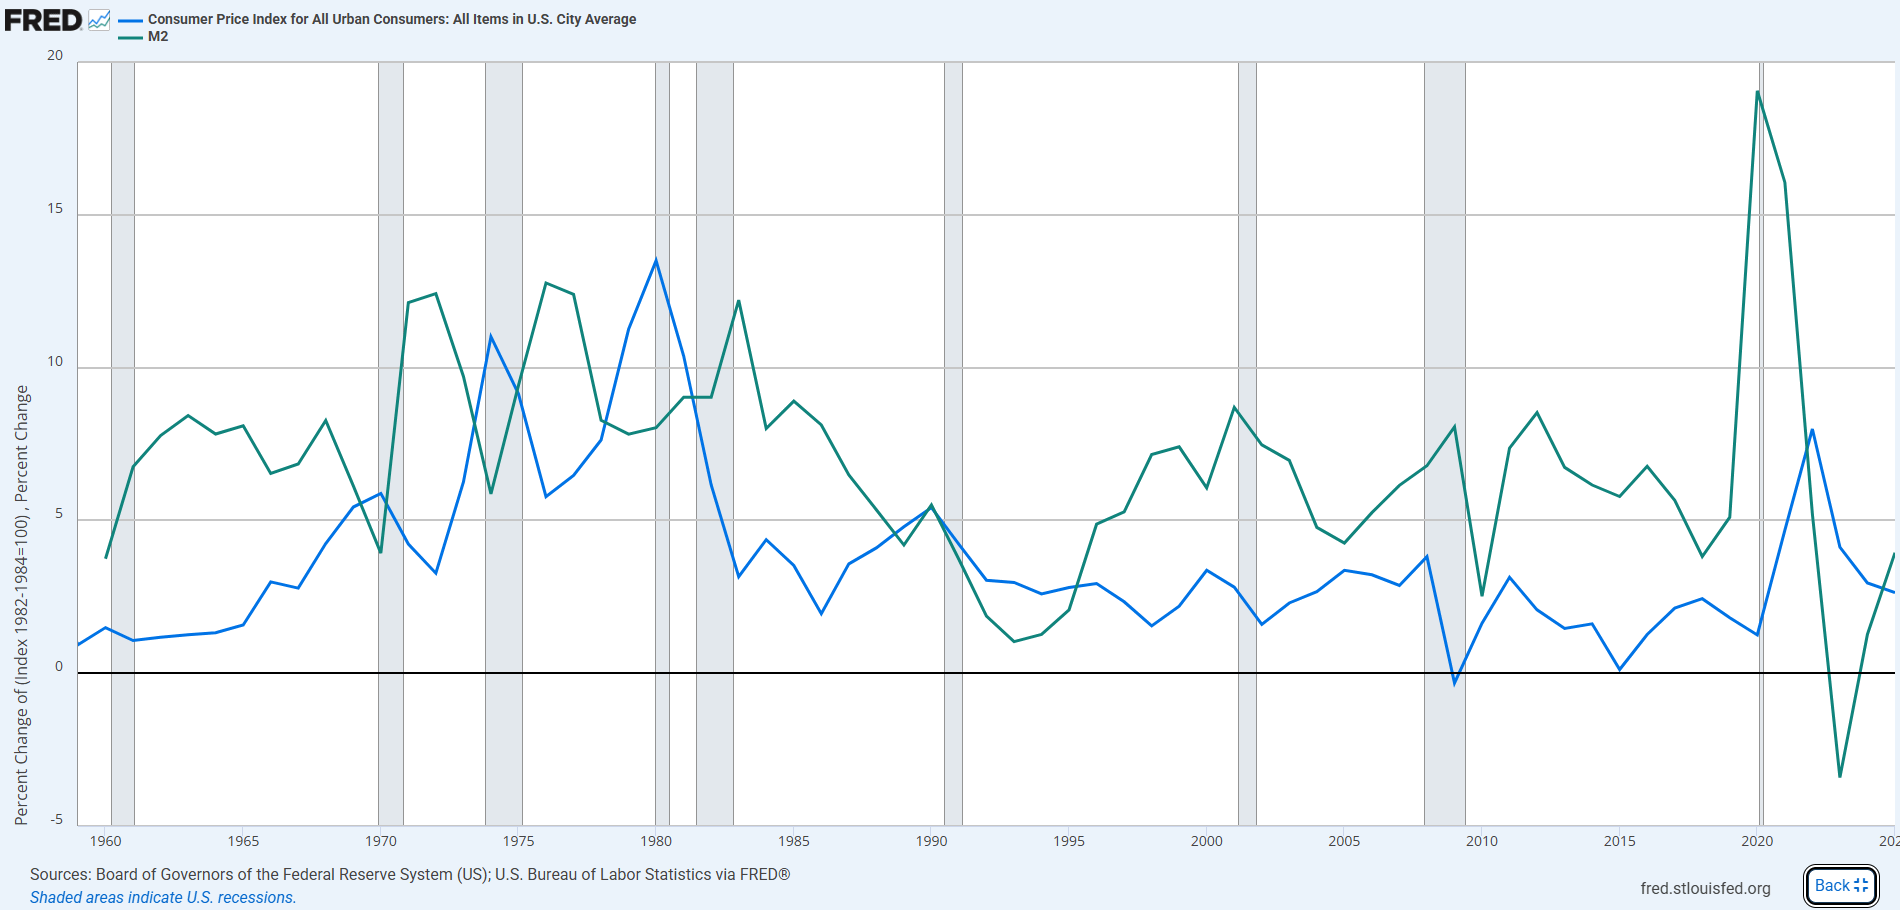
Inflation is closely linked to the aggregate amount of dollars in the system.
Absent large increases in the money supply (think 2020), broad based inflation is rare.
You can see the tight correlation between money supply (green) and inflation (blue) dating back to 1960 here:
The Big Picture
The data below from the Bureau of Labor Statistics demonstrates how the price of select goods and services has changed over the last 25 years.
Why have some categories become more expensive and others more affordable?
Macro strategist Lynn Alden recently offered an explanation.
The red categories depend on domestic labor. Prices have increased roughly in-line with labor costs.
The blue categories have benefitted from offshoring and automation. Technology drives efficiency.
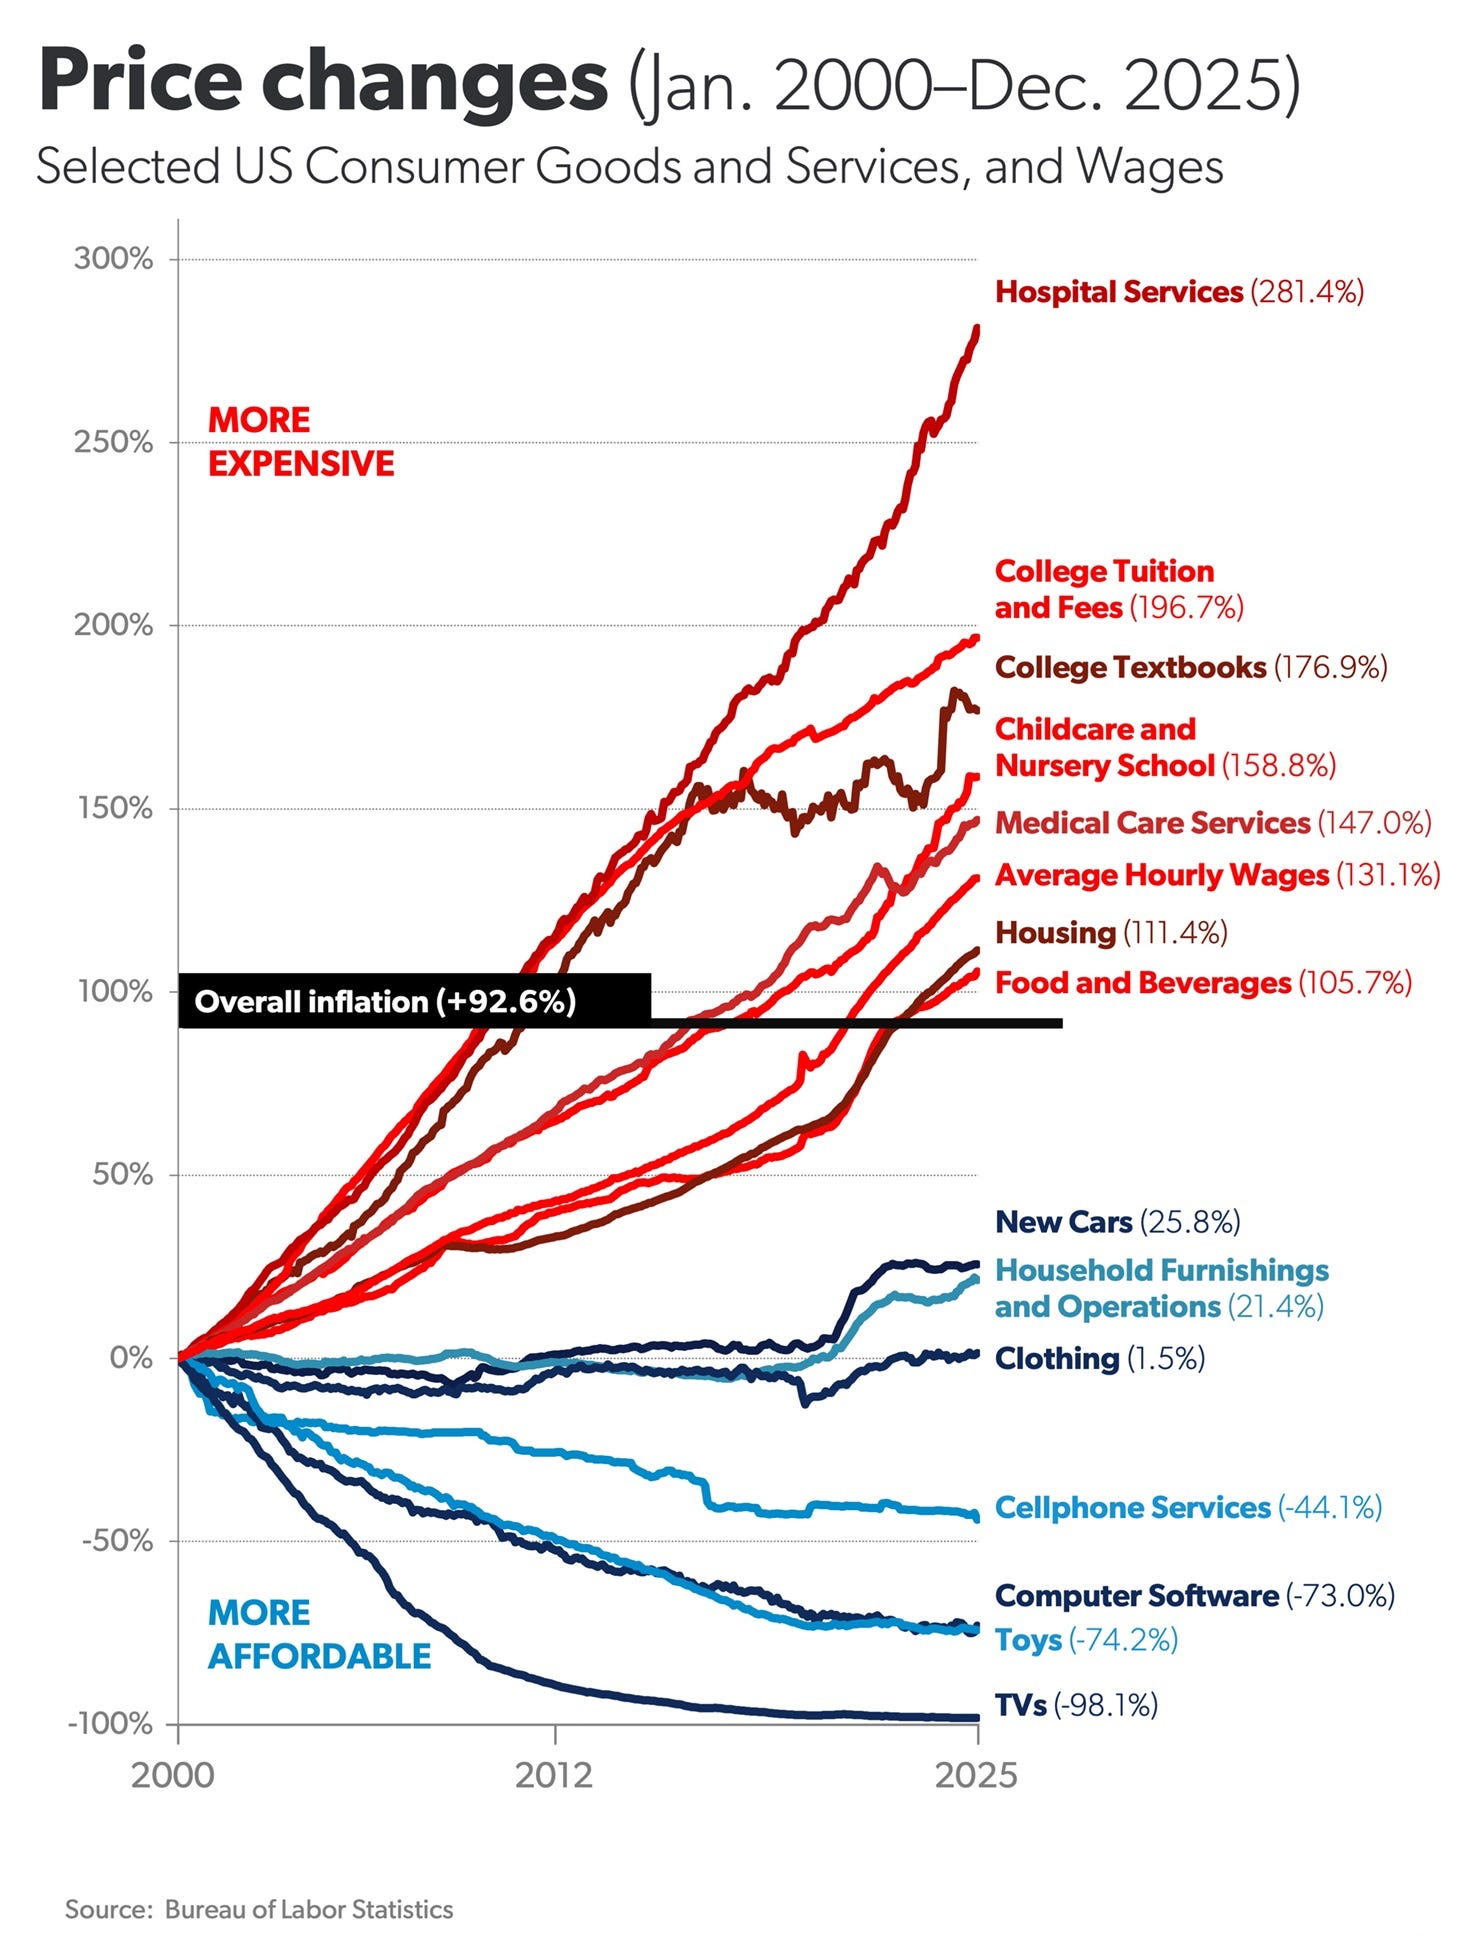
If we compare price increases to growth in the money supply, the impact of technology becomes even more evident.
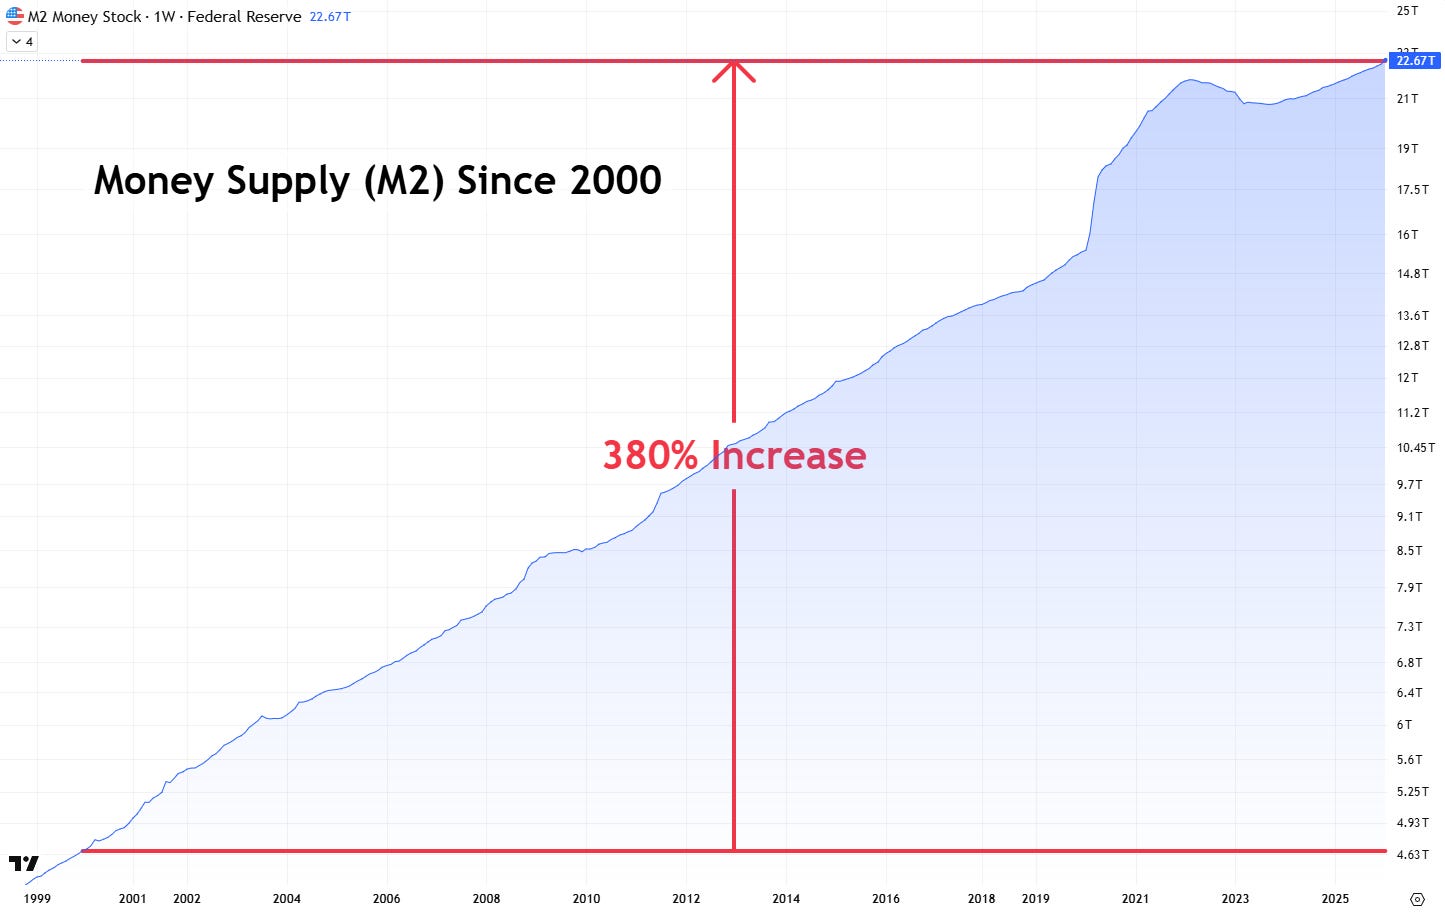
Money supply has grown at 380% over the same 25 year period.
Expansion in the money supply has outpaced price increases in all categories.
In other words, nearly all goods and services have become more efficient over time.
Technology is a persistent deflationary force and more powerful than a short term energy shock.
With technology accelerating at the fastest pace in history, longer term prices are likely to remain contained.
Policy:
“It is of course kind of standard learning that you look through energy shocks.” —Jerome Powell, Chairman of the Federal Reserve, March 2026
If policymakers agree that inflation will be temporary, they can look through it.
They are unlikely to tighten spending or raise interest rates.
That’s good news for asset prices.
That’s because inflation is a serious constraint on government spending and interest rates.
Federal government spending drives nearly 40% of GDP.
Further, rising interest rates can impact asset prices negatively.
When inflation spiked to 9% in 2022, ensuing interest rate hikes contributed to a nearly 30% correction in the S&P500.
Conclusion:
If inflation stays contained, government spending and interest rate policy can remain accommodative.
This conclusion allows us to stay long risk assets in the current uncertain environment.
If policymakers can look through inflation, markets can too.
https://www.federalreserve.gov/econres/notes/feds-notes/detecting-tariff-effects-on-consumer-prices-in-real-time-part-II-20260408.html
https://www.oecd.org/en/publications/oecd-economic-outlook-interim-report-march-2026_d4623013-en.html
How does the labor market play into this?