

MSTR: A Technical Trade


Summary:
The chart of MSTR reveals an attractive short-term buying opportunity
The current price level allows for well-defined risk
If correct, the bet could return 57% or more
[3 minute read]
Introduction
A few times each year, a technical trade catches my eye.
This is one of those times.
I spoke last week about the advantages of a long holding period, the power of compounding, and the difficulty in predicting price over short time horizons. While this setup involves a shorter holding period, it offers a profit opportunity with narrowly defined risk.
When I position for purely technical trades, I do so with less than 1% of my portfolio and a tight stop.
I’m not here to discuss the fundamentals of MSTR or the risks in their capital structure—that’s a conversation for another time.
With those disclaimers out of the way, let’s discuss the trade.
Bitcoin
In The Bear Case, I discussed my cautious outlook on bitcoin. I mentioned BTC was oversold in the short term, and that I was looking for a bounce towards the psychologically significant $100k level.
Since then, BTC briefly rallied above $94k but has largely traded sideways inside a range.
I still think a move towards $100k is possible.
MSTR is a leveraged bet on bitcoin and deeply oversold—down over 70% from its highs.
The combination of those factors could be significant if a reversal takes hold.
Charts
My favorite technical trades are when two distinct patterns line up across different time horizons and confirm the same view.
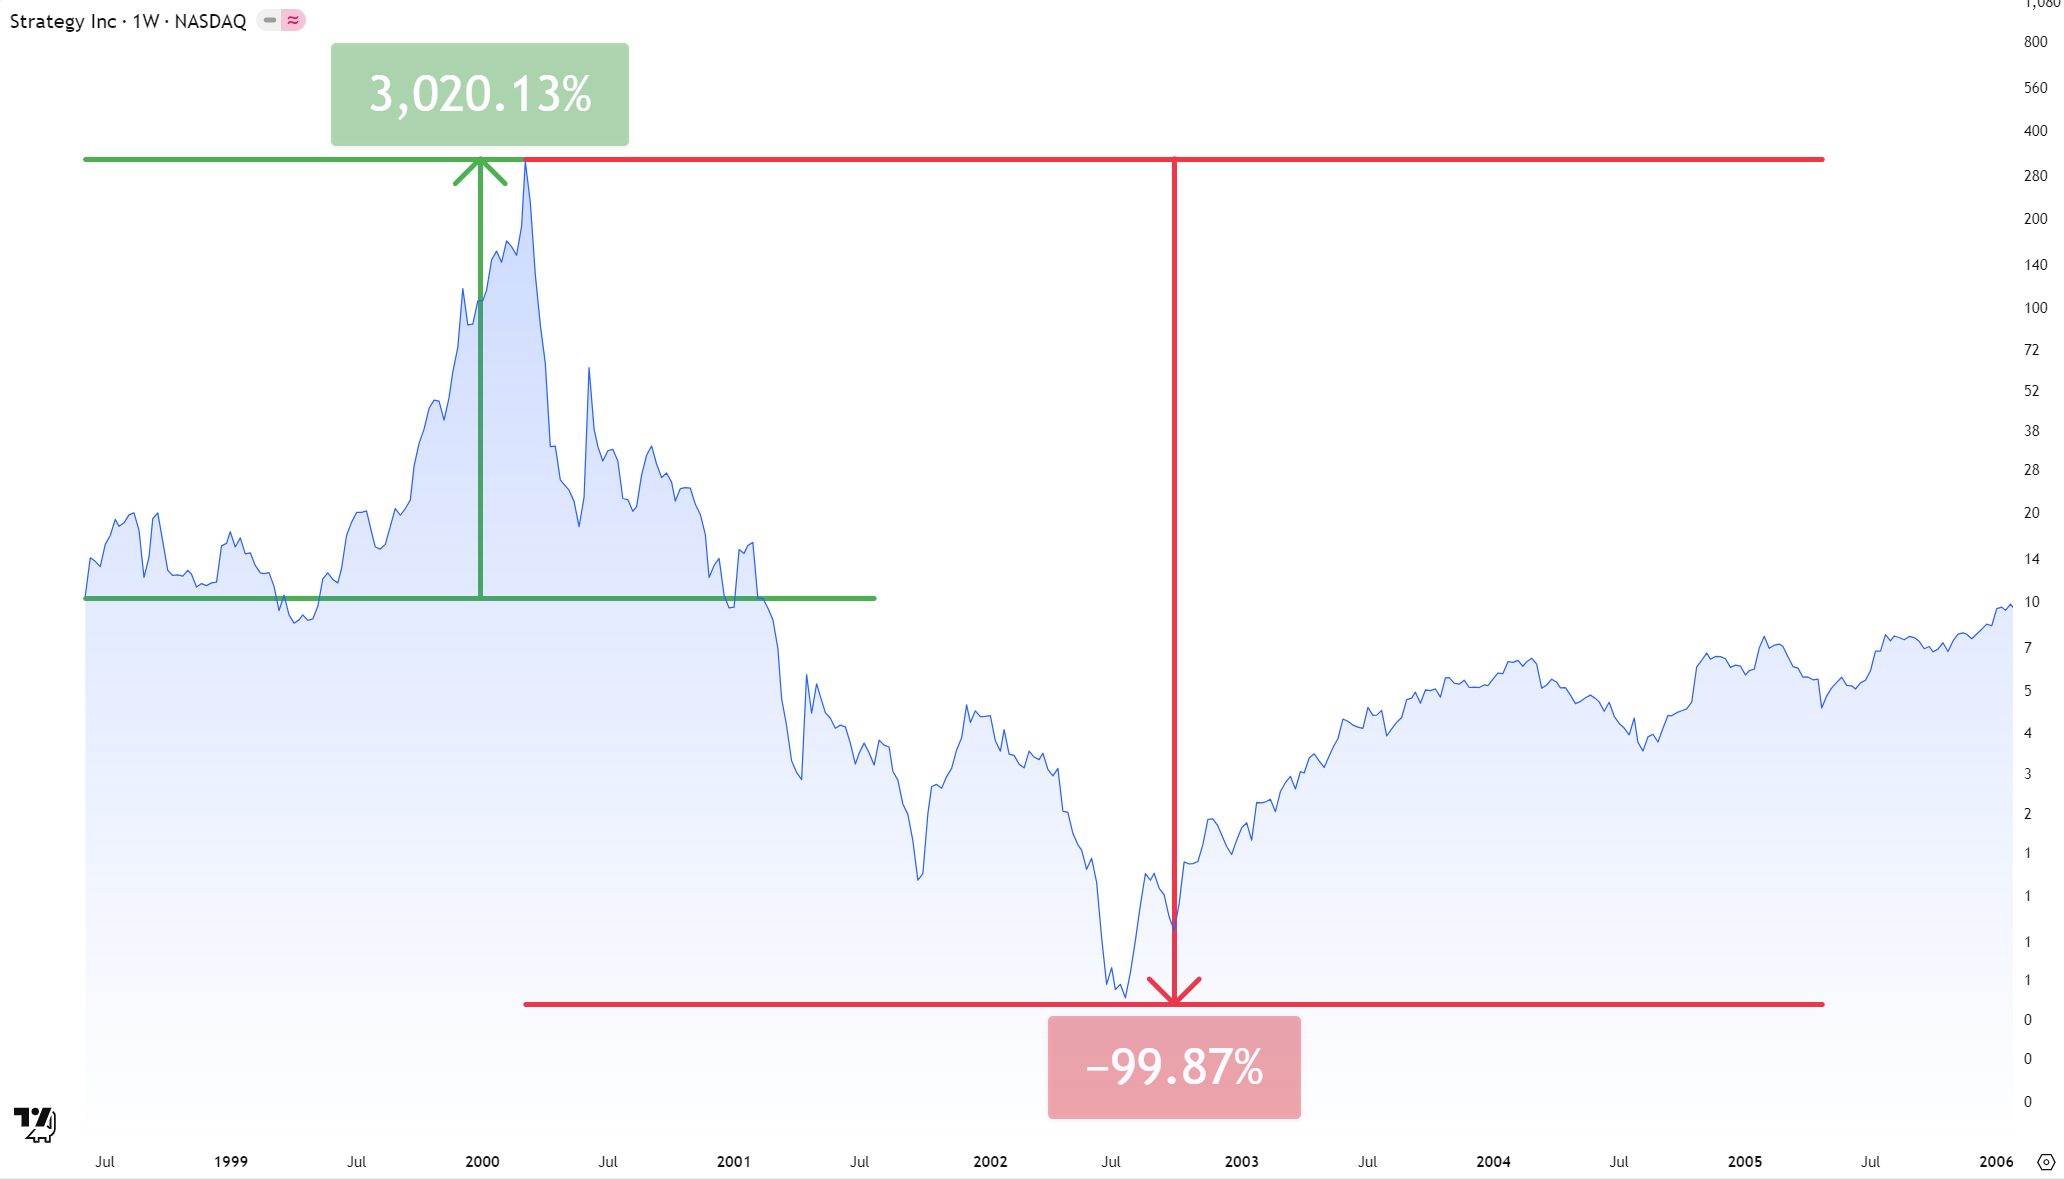
MSTR went public in 1998 during the dot com bubble.
From its IPO price to the 2000 high, it rallied over 3,000% to > $300/share.
Following the 2000 top, MSTR declined 99.9%, bottoming at $0.42 in July of 2002.
Since that time, MSTR has largely transformed into a fundamentally different business—a bitcoin treasury company.
It’s hard to imagine that MSTR investors in 2026 have any memory of the 2000 high or place much significance on it, but the chart suggests that they might.
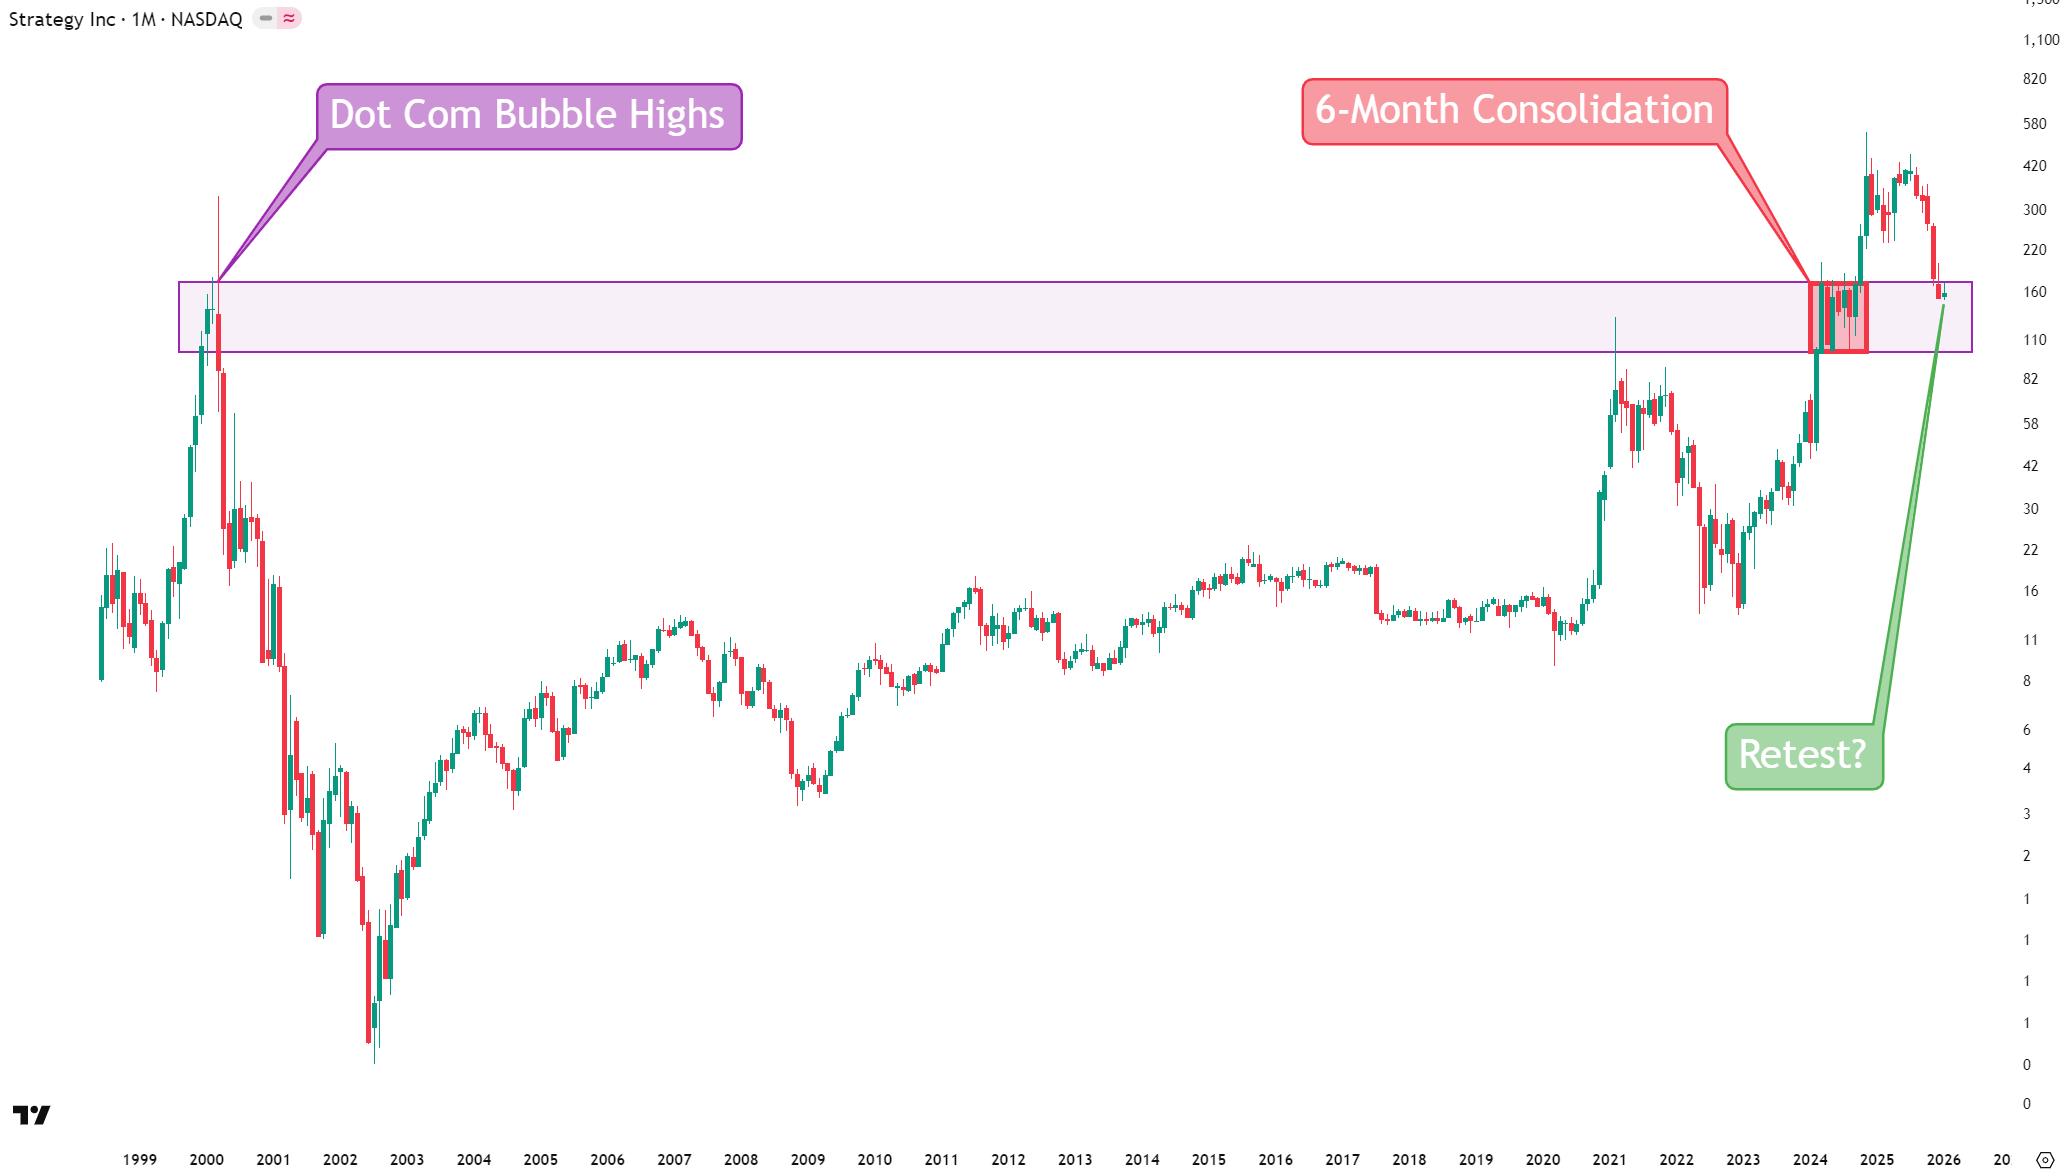
During the 2024 bitcoin bull market, MSTR rallied to an intermediate high of $200/share.
The following six months, it consolidated sideways underneath the 2000 dot com bubble highs (red box in my chart below).
In October of 2024, it broke higher out of the consolidation and ran to new all-time highs—ultimately topping at $543/share in November of that year.
The selloff that followed took MSTR down over 70% to the current price of $157/share—and this is what caught my eye.
At the current price of $157/share, MSTR is sitting near the monthly closing highs from the dot com bubble and the top of the 2024 consolidation.
Will resistance become support?
Levels
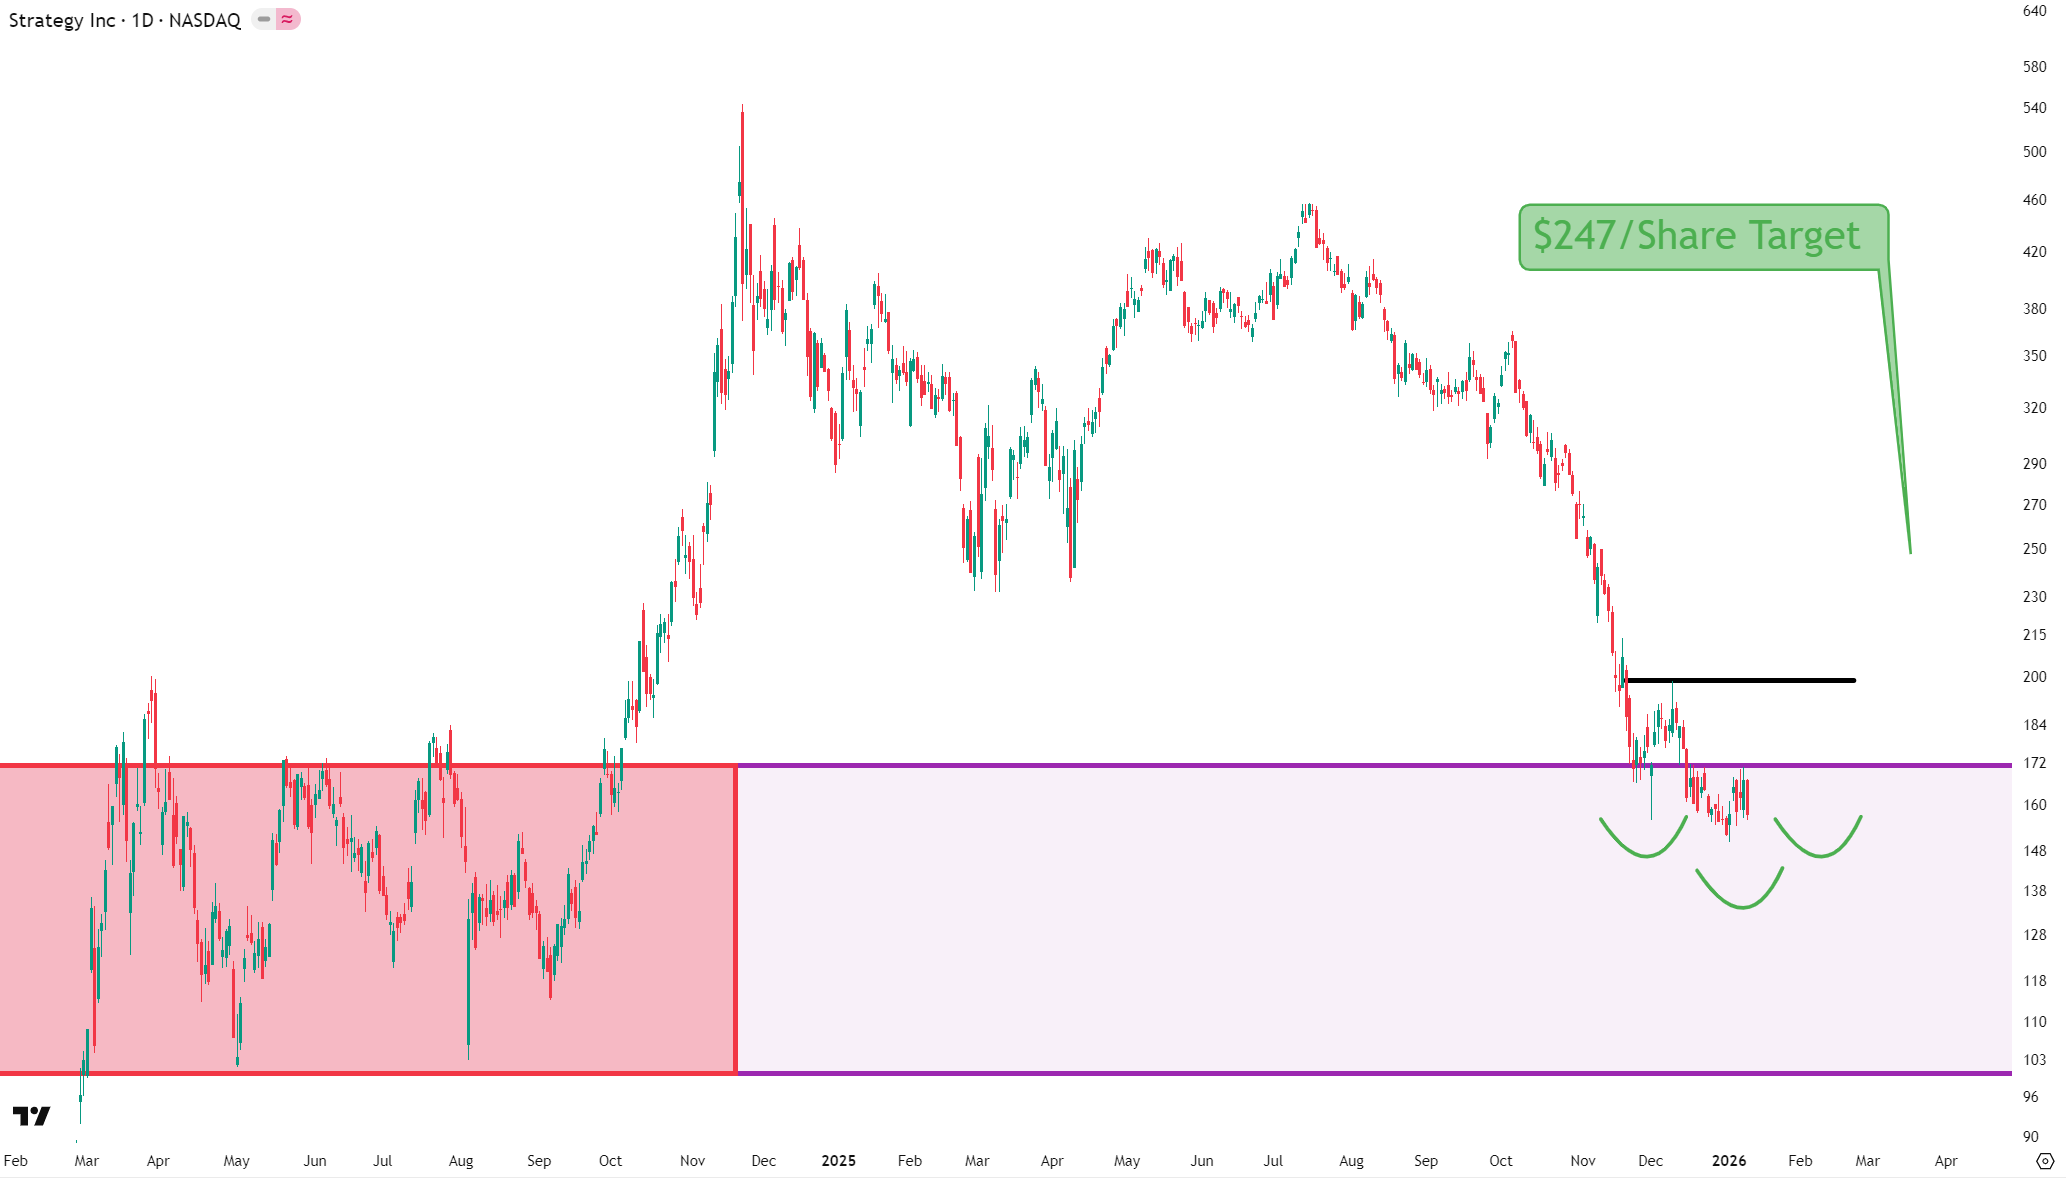
Let’s zoom in and observe how MSTR is behaving around that key support level.
The daily chart reveals the potential for a familiar pattern, a bottom known in classical charting as an inverse head and shoulders.
If the pattern is valid, we should expect a move back towards $200/share (black line in my chart below). A break higher from there projects towards $247/share, a 57% gain.
As I type, MSTR is sitting near what could be the local low. That view allows for a tight stop. I wouldn’t risk more than 15% to the downside.
Conclusion
Three reasons I like this setup:
I expect bitcoin to trade higher in the short term
The long-term chart of MSTR confirms this view
The short-term chart of MSTR allows for well-defined risk
If I’m wrong, I stand to lose 15%.
If I’m right, I stand to gain 57%—nearly 4x the potential downside.
Asymmetry with well-defined risk.
great work on the charts! i liked the post a lot!